Record Sync Example - Sales Calculator
This guide walks you through building a Sales Calculator - a Google Sheets spreadsheet that stays automatically synchronized with Opportunity Product line items in Salesforce. Every time a product is added, edited, or removed from an Opportunity, the corresponding row in the spreadsheet is created, updated, or deleted - all without any manual work from the sales rep.

Use Case
Sales teams often need a workspace outside of Salesforce where they can model deals - analyzing margins, projecting commissions, running what-if scenarios on discounts and upsells - using advanced spreadsheet features that go beyond what Salesforce provides. The challenge is keeping this workspace in sync with the source of truth in Salesforce.
With DriveMate, you can design a rich spreadsheet template once and let Flows copy it and sync only the raw data. All formulas, charts, formatting, and cross-sheet references carry over automatically and update as data flows in.
How It Works
The approach separates Salesforce-managed data from spreadsheet-only analysis:
- A pre-built template is designed in Google Sheets with multiple sheets, formulas, charts, conditional formatting, and a what-if scenario panel.
- When an Opportunity is created, a Flow copies the template into the customer's Google Drive folder.
- When products are added, edited, or removed, record-triggered Flows sync the raw data to a dedicated (hidden) data sheet inside the copied spreadsheet. All the analysis sheets update automatically through formulas.
The rep opens the spreadsheet and immediately sees a live deal analysis dashboard - without ever touching the data layer.
What You Will Build
| Flow | Trigger | DriveMate Actions Used |
|---|---|---|
| Create Sales Calculator | Opportunity created | Create Folder, Copy File, Refresh DriveMate Component |
| Sync Line Item Creation | Product added | Append Row to Sheet |
| Sync Line Item Edits | Product edited | Edit Rows in Sheet |
| Sync Line Item Deletion | Product removed | Delete Rows by Criteria (Async) |
Template Structure
The template spreadsheet has three sheets:
Opportunity Products (Salesforce-managed, hidden)
This is the only sheet your Flows write to. It holds raw data from Salesforce and is hidden from the rep.
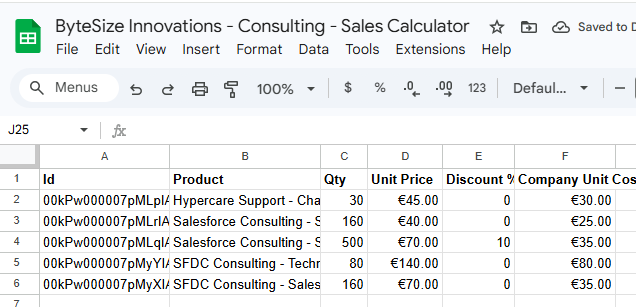
The screenshot above shows the sheet after Salesforce data has been synced. In the template itself, this sheet contains only the header row - product rows are appended automatically by the sync Flows as products are added to the Opportunity.
| Column | Header | Source |
|---|---|---|
| A | Id | OpportunityLineItem record ID (used as a row key for edit/delete sync) |
| B | Product | Product name |
| C | Qty | Quantity |
| D | Unit Price | Selling price per unit |
| E | Discount % | Discount percentage (0 if blank) |
| F | Default Unit Cost | Standard unit cost from the Product record |
Sales Calculator (presentation layer - what the rep sees)
This sheet contains no Salesforce data directly - everything is powered by formulas that reference the Opportunity Products sheet.
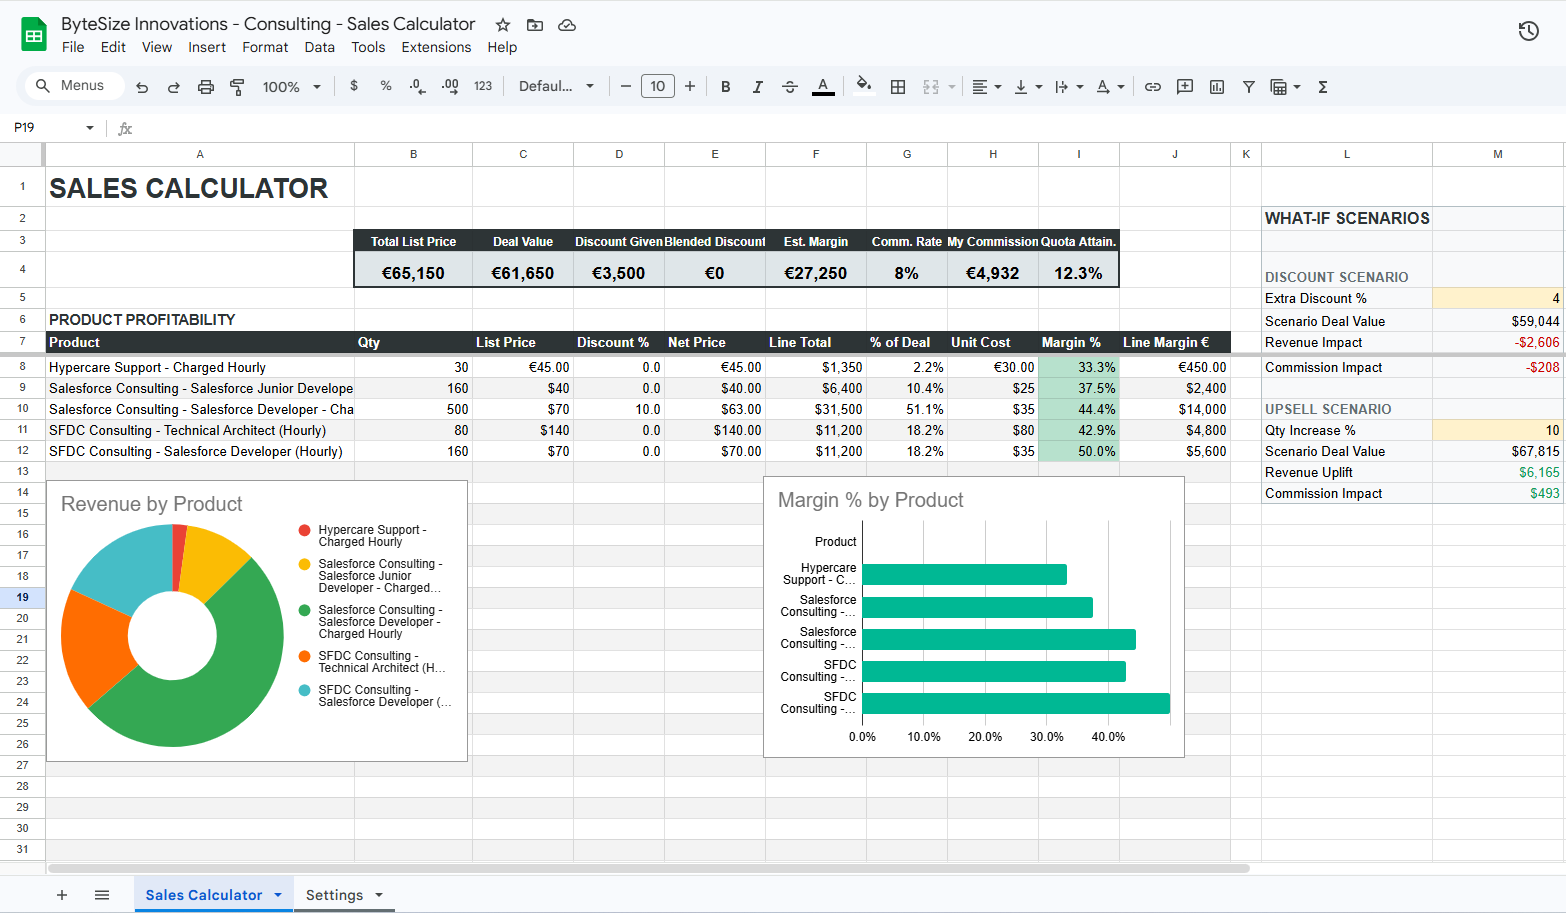
The screenshot above shows the sheet with synced data - populated KPIs, a filled product table, and charts with real values. In the template itself, this sheet will appear mostly empty: KPIs will show zeros, the product table will have no rows, and charts will be blank. Everything populates automatically once the sync Flows start writing product data to the Opportunity Products sheet.
- KPI dashboard strip - Total List Price, Deal Value, Discount Given, Blended Discount, Estimated Margin, Commission Rate, Commission $, Quota Attainment.
- Product Profitability table - Each product with its net price, line total, percentage of deal, unit cost, margin %, and line margin. Uses
ARRAYFORMULAso it dynamically expands as products are added. - What-If Scenarios - Input cells where the rep can model "What if I give an extra 5% discount?" or "What if I upsell 20% more quantity?" and instantly see the impact on deal value and commission.
- Charts - Donut chart showing revenue breakdown by product, and a bar chart showing margin health by product with color-coded conditional formatting.
Settings (configuration)
A sheet where the rep (or their manager) configures:
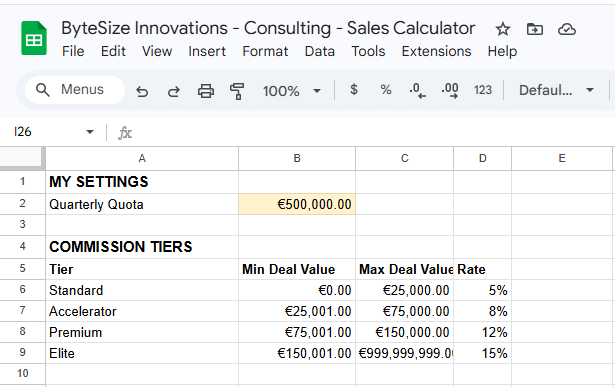
- Commission tiers - A lookup table that maps deal value ranges to commission rates.
- Quarterly quota - The rep's target, used to calculate quota attainment in the KPI strip.
Key Benefits
- No formula management in Flows - Your Flows only write 6 plain data values per row. All the complex logic (margins, commissions, what-if scenarios, charts) lives in the template.
- Rich analysis out of the box - The rep opens the spreadsheet and sees a full deal dashboard with KPIs, profitability metrics, and interactive scenarios.
- Design once, copy many - The template is your single source of truth. Update the template and all future copies inherit the changes.
- Clean separation - Salesforce owns the data (hidden sheet). The rep owns the analysis (visible sheets). No accidental overwrites.